5714.00 UPS
Map: jeoffrey
Factorio 1.1.110 (build 62357, linux64, full)
Memory (24 GiB)
- 3x 8 GiB at 2133 MHz
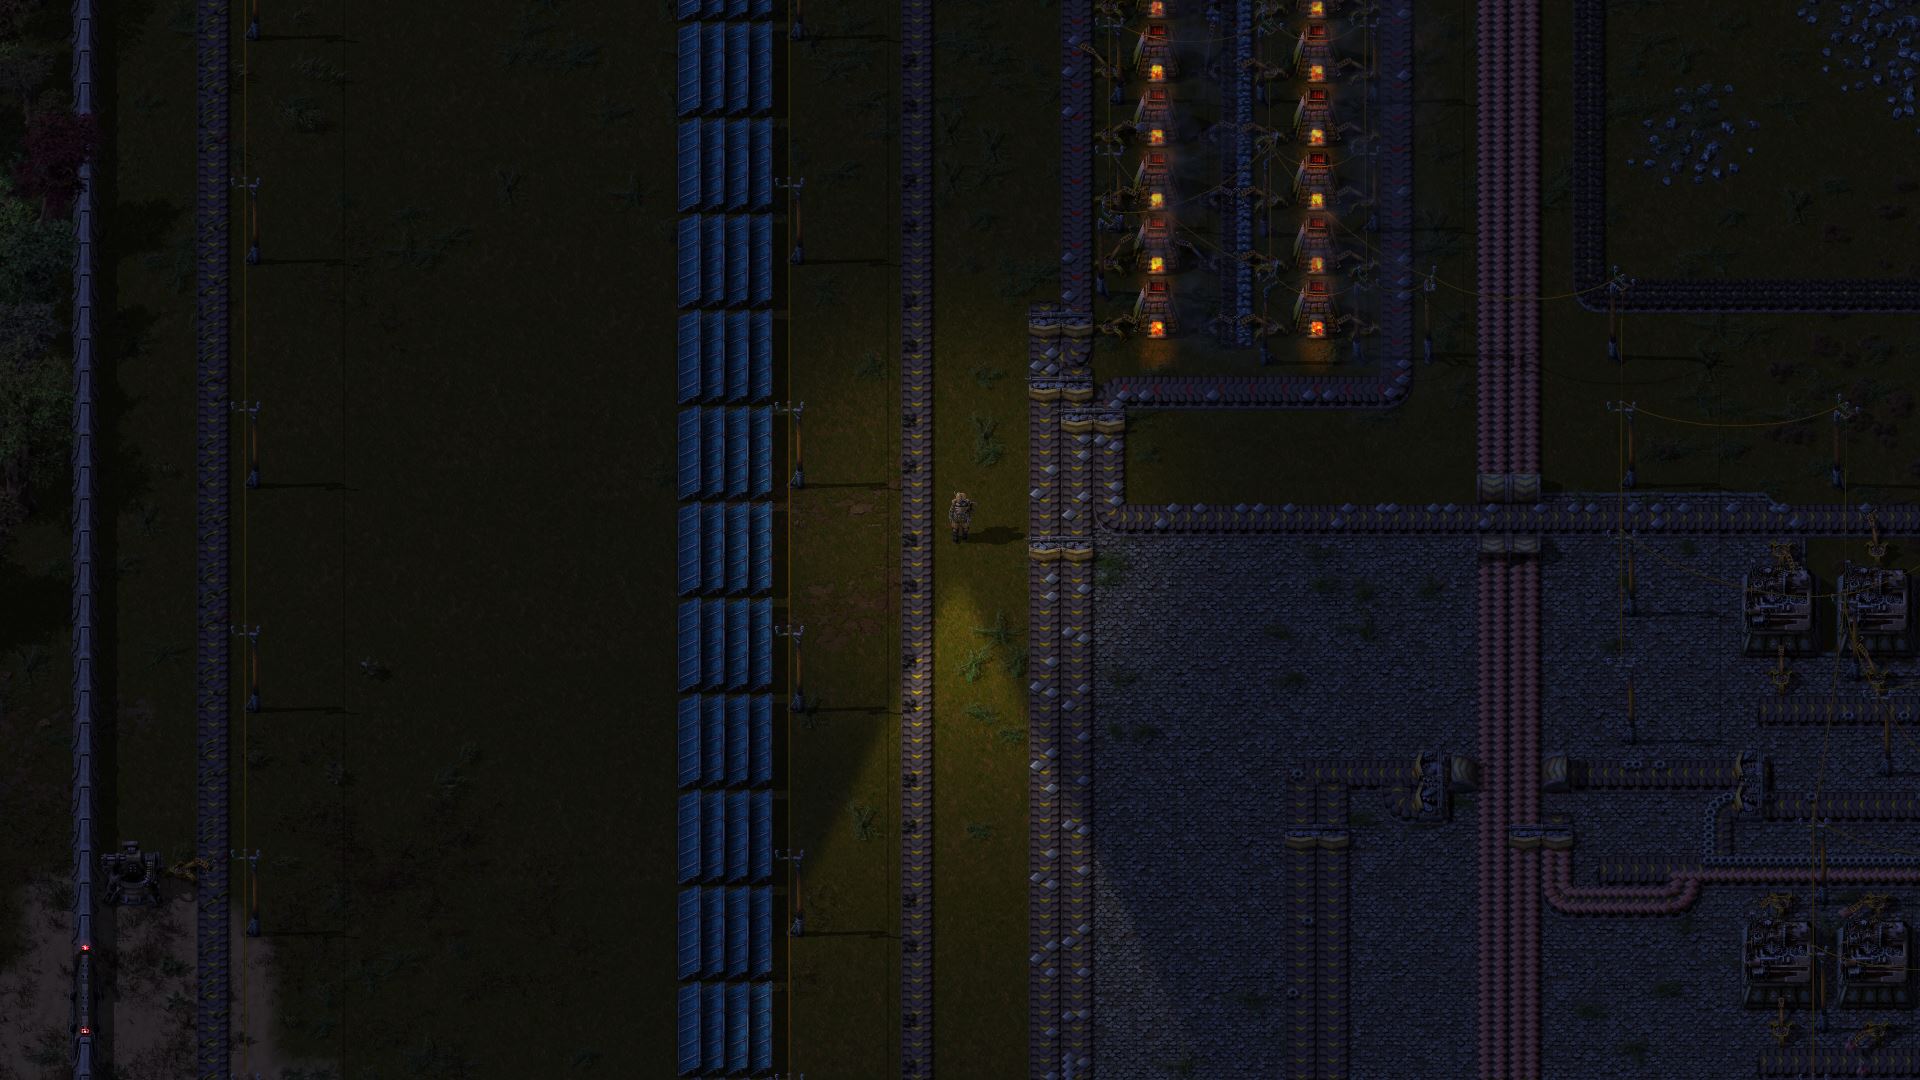
map de jeoffrey
c37be2df98e8b7437fe823c8836e9d901ea1c7b07ede2e297720dbbfe10f2324
3 benchmark results
Saved with Factorio 1.1.87
Internal save version: 1.1.87.0
The fourth number is Factorio's internal developer version.
Factorio must be installed in the same operating-system environment as the script. On Windows, use PowerShell rather than WSL. The script never uses sudo and shows the submission before sending it.
Leave blank to auto-detect. Otherwise, enter the full path to the executable, its containing folder, or the Factorio installation folder (.app on macOS). Commands update as you type; this path stays in your browser.
Windows: C:\Games\Factorio_2.1.17
Linux: /home/you/factorio/bin/x64/factorio
macOS: /Applications/Factorio.app
curl -fL 'https://factoriobench.com/scripts/benchmark.sh?map=c37be2df98e8b7437fe823c8836e9d901ea1c7b07ede2e297720dbbfe10f2324' -o benchmark.sh && bash benchmark.sh
& { $code = (Invoke-WebRequest -UseBasicParsing 'https://factoriobench.com/scripts/benchmark.ps1?map=c37be2df98e8b7437fe823c8836e9d901ea1c7b07ede2e297720dbbfe10f2324' -ErrorAction Stop).Content; $code; if ((Read-Host 'Run this script? [y/N]') -match '^[Yy]$') { & ([scriptblock]::Create($code)) } }3 results across all Factorio versions. Each bar groups a UPS range.
Hover or focus a bar to inspect it.
View all results for this map · Compare CPUs on this map
Map: jeoffrey
Factorio 1.1.110 (build 62357, linux64, full)
Memory (24 GiB)
Map: jeoffrey
Factorio 1.1.110 (build 62357, linux64, full)
Memory (24 GiB)
Map: jeoffrey
Factorio 2.0.20 (build 80511, win64, steam)
Memory (8 GiB)