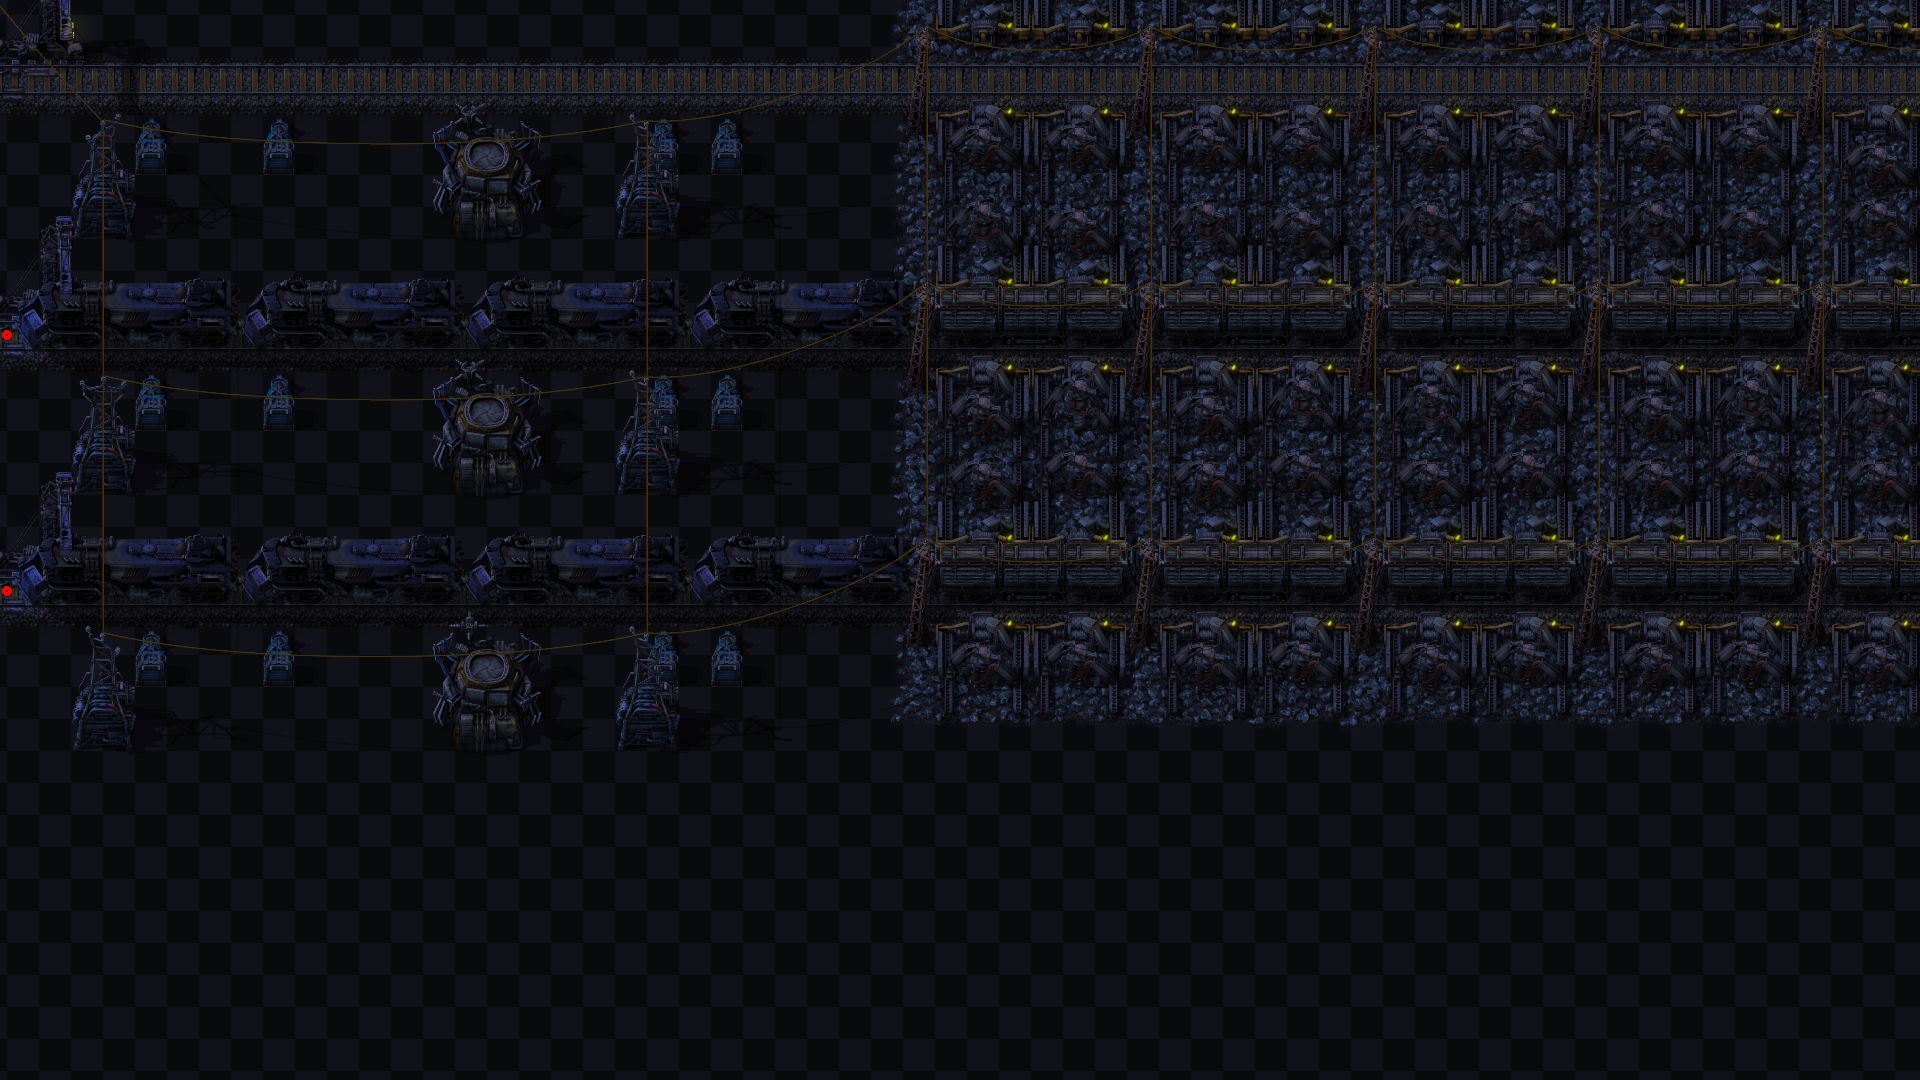
Preview of Stevetrov's 20K (4x5K) Rail Factory megabase

Stevetrov's 20K (4x5K) Rail Factory megabase

Available

Runs at > 60 UPS on my laptop.

0520bc63b5c78ac5a8d314d9a3df36b31e0e33bd6ac0821f7ca9192acd5d7cef
124 benchmark results
Saved with Factorio 1.1.33

Save details

Internal save version: 1.1.33.0
The fourth number is Factorio's internal developer version.

Benchmark this map

Factorio must be installed in the same operating-system environment as the script. On Windows, use PowerShell rather than WSL. The script never uses sudo and shows the submission before sending it.

Linux / macOS

curl -fL 'https://factoriobench.com/scripts/benchmark.sh?map=0520bc63b5c78ac5a8d314d9a3df36b31e0e33bd6ac0821f7ca9192acd5d7cef' -o benchmark.sh && bash benchmark.sh

Windows PowerShell

& { $code = (Invoke-WebRequest -UseBasicParsing 'https://factoriobench.com/scripts/benchmark.ps1?map=0520bc63b5c78ac5a8d314d9a3df36b31e0e33bd6ac0821f7ca9192acd5d7cef' -ErrorAction Stop).Content; $code; if ((Read-Host 'Run this script? [y/N]') -match '^[Yy]$') { & ([scriptblock]::Create($code)) } }

Result distribution

124 results across all Factorio versions. Each bar groups a UPS range.

Result distribution Histogram of 124 results from 30.00 to 154.00 UPS. 5 results (4%): 30.00–40.33 UPS23 results (18.5%): 40.33–50.67 UPS17 results (13.7%): 50.67–61.00 UPS22 results (17.7%): 61.00–71.33 UPS12 results (9.7%): 71.33–81.67 UPS7 results (5.6%): 81.67–92.00 UPS6 results (4.8%): 92.00–102.33 UPS9 results (7.3%): 102.33–112.67 UPS6 results (4.8%): 112.67–123.00 UPS14 results (11.3%): 123.00–133.33 UPS1 result (0.81%): 133.33–143.67 UPS2 results (1.6%): 143.67–154.00 UPS

Hover or focus a bar to inspect it.

View all results for this map · Compare CPUs on this map

Recent results